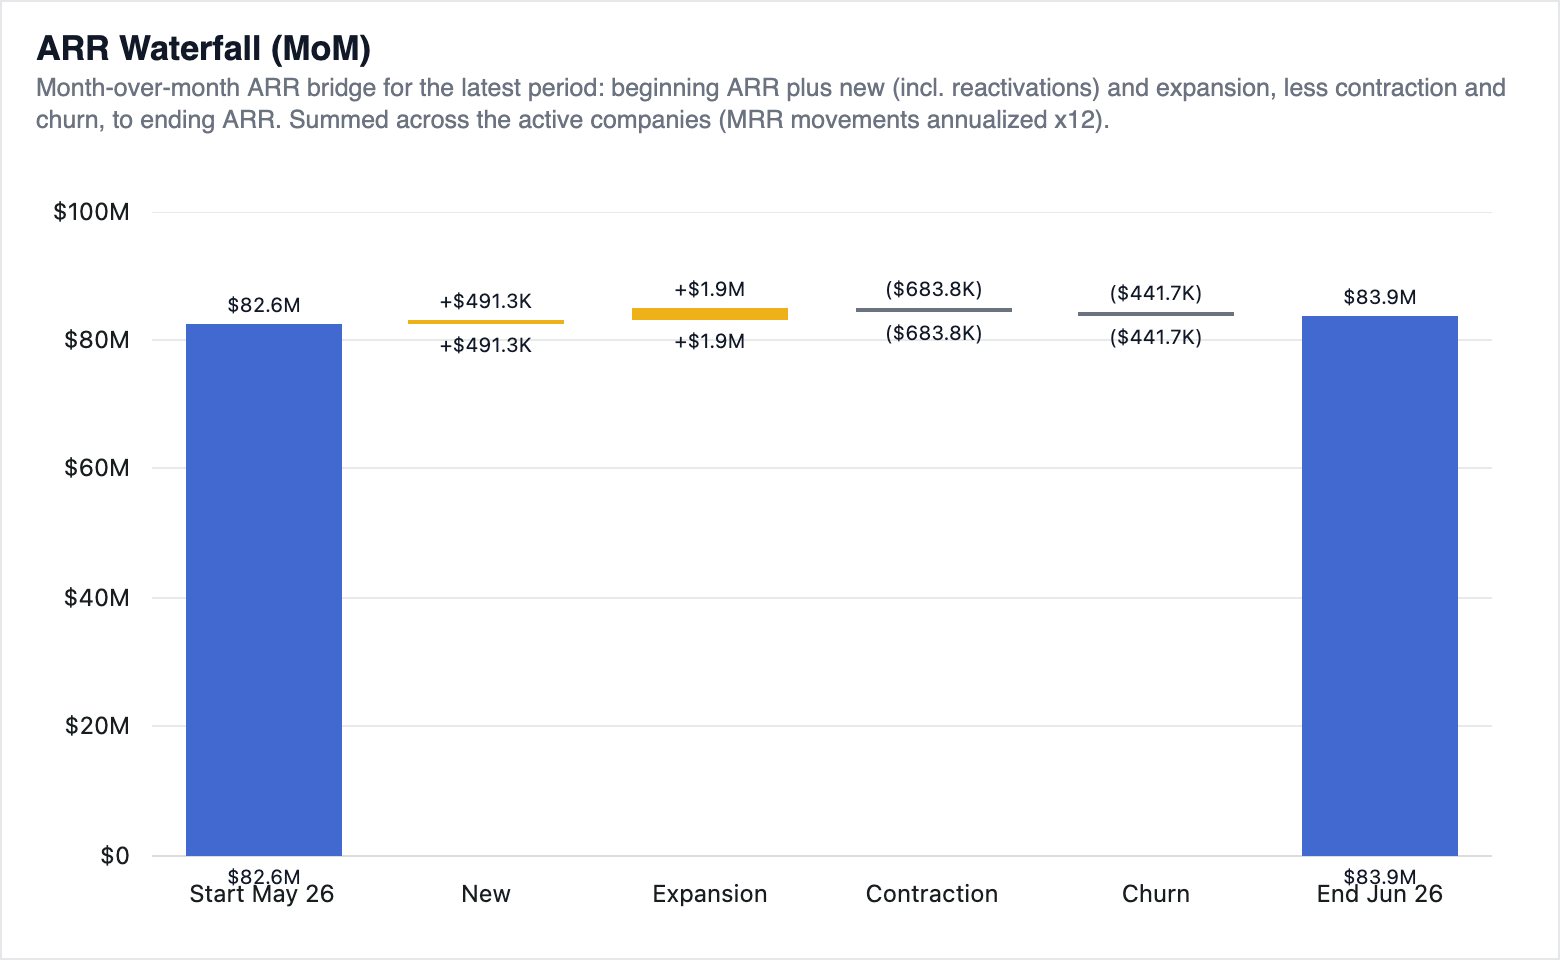
Recreate the month-over-month MRR movement waterfall from a screenshot using the widget DSL and data warehouse.
- Version
- Category
- software-engineering
- Difficulty
- hard
- Model configurations
- 1
- Attempts
- 3
- Public trials
- 30 passed
- Median runtime
- 12m 40s
Instruction
# Recreate the MRR Waterfall graph from the reporting pack

The portfolio's monthly reporting pack includes the graph shown in
`assets/target.png`: a month-over-month MRR bridge from the prior month's ending base through new, expansion, contraction, and churn movements.

Recreate it as a standalone graph definition at `graphs/arr-waterfall-mom.json`, using
the warehouse data and the graph definition contract and house conventions
documented in `contracts/README.md`. The graph takes no dashboard parameters.

Match the chart as rendered: its data, point labels, legend, axes, and theme
colors. The definition must keep producing the correct reporting window as new
monthly actuals land, without further edits.

Check your work with `node contracts/validate.mjs graphs/arr-waterfall-mom.json`.
Public trials
Results by model
| Model · harness | Mean reward | Range | ± SE | Attempts |
|---|---|---|---|---|
| Muse Spark 1.3 ContributorOpenCode | 30.7% | 28% – 32% | 1.3 pp | 3 |